Traverse Standard v11.0
Sales Analysis Report
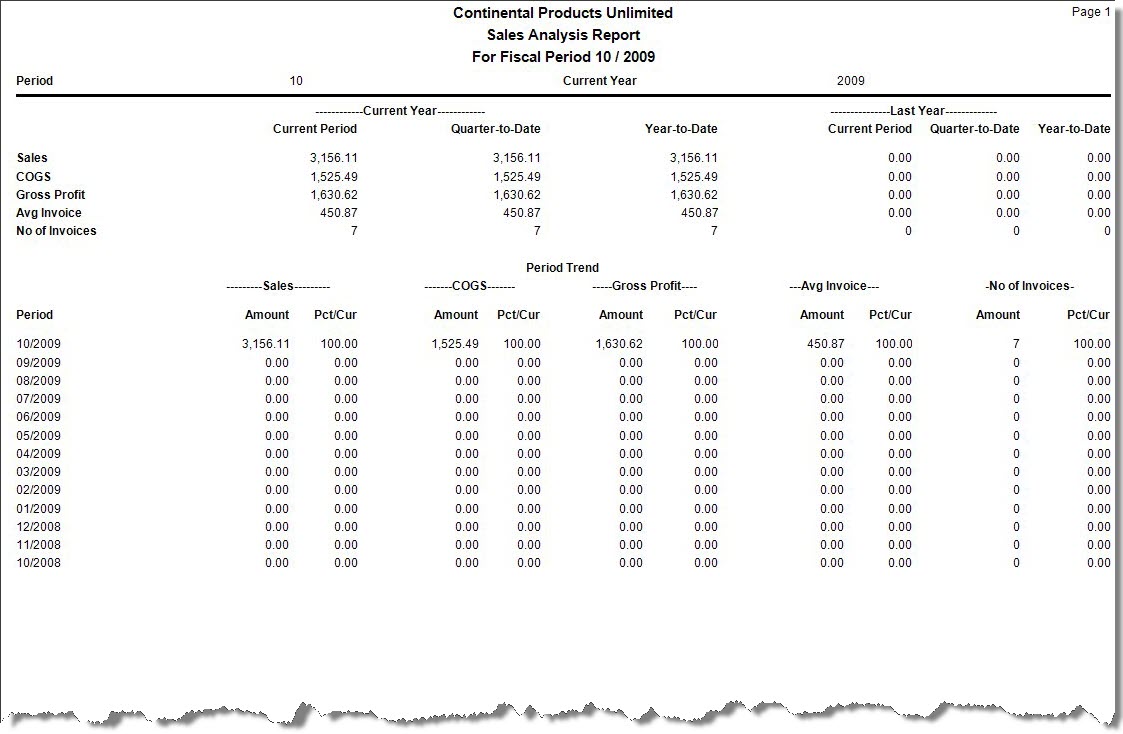
The Sales Analysis Report provides an analysis of your company's sales based on the period you specify and the last fiscal year's trends by period.
The report has the following sections:
- The first section of the report shows the current and previous years’ sales, COGS, gross profit, average invoice amounts, and number of invoices for the reporting period, quarter, and year.
The sales, COGS and number of invoices amounts come from summary history. The sales amount does not include freight, tax, or miscellaneous amounts. The gross profit is sales minus the COGS amount. The average invoice for the current period is sales divided by the number of invoices. The quarter-to-date and year-to-date average invoice amount is the sum of the appropriate previous periods' average invoice amount. It is not the QTD sales/QTD number of invoices or YTD sales/YTD number of invoices.
- The second section of the report shows the sales, COGS, gross profit, average invoice amount, and number of invoices for the reporting period and the previous 12 periods.
The Pct/Curr column is the amount listed, divided by the amount for the current period.
- The third section of the report shows a graph of the sales trend.
- Select the period for the report from the Period field.
- Select the fiscal year for the report from the Year field.
- Click a command button to
| Click | To |
| Process the Sales Analysis Report. | |
| Output | Output the report as a PDF. |
| Send | Save the report as a PDF and attach it to an email using your default mail program. |
| Preview | View a preview of the Sales Analysis Report. |
| Reset | Set all fields to their default values. |