Traverse Standard v11.0
Column Grouping Examples
These are some examples of column grouping.
AP Vendor View
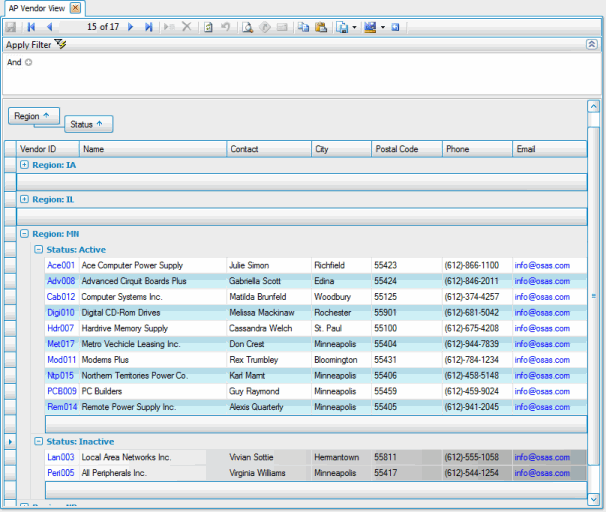
You can group entries by identical column information to form expandable groups. To group by columns, click on the heading of the column to group and drag the heading to the Drag a column header here to group by that column section, above the other column headings. For instance, you could group by two columns. Your primary group could be Region, and your secondary group Status. This would allow you to expand a region and view Vendor IDs grouped by Active and Inactive statuses.
AP Invoice View
AP Aged Trial Balance View
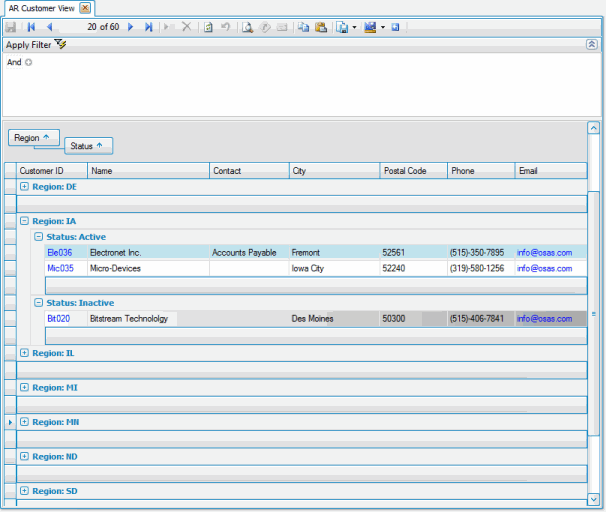
AR Customer View
You can group entries by identical column information to form expandable groups. To group by columns, click on the heading of the column to group and drag the heading to the Drag a column header here to group by that column section, above the other column headings. For instance, you could group by two columns. Your primary group could be Region, and your secondary group Status. This would allow you to expand a region and view Customer IDs grouped by Active and Inactive statuses.
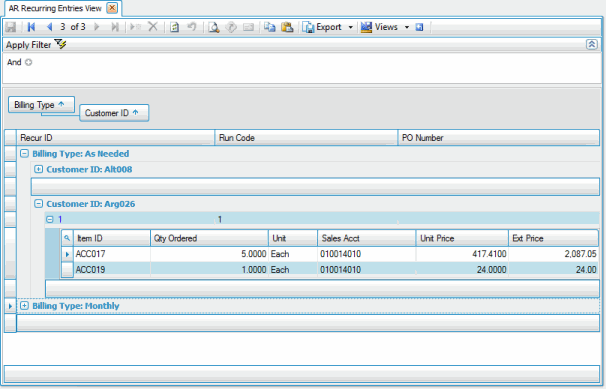
AR Recurring Entries View
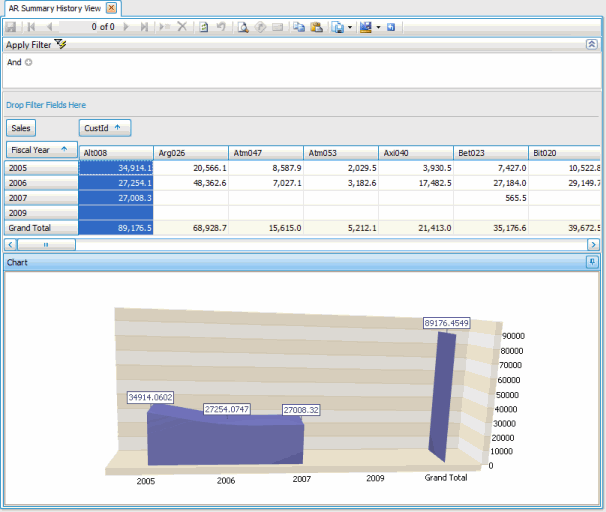
AR Summary History View with Graphing Data
You can use the list of field headings to graph information. To graph information, simply click on the heading of the field and drag the heading to the Drop Data Items Here, Drop Row Fields Here, and/or Drop Column Fields Here sections. To not include a field as part of the graph, you can drag the heading to the Drop Filter Fields Here section, you can right-click on the heading and select Hide, or you can open the Field List editor and drag the heading into the list.
For instance, you could graph the sales made by each customer in each fiscal year. One way to do this would be to drag the Fiscal Year field to the Drop Row Fields Here section, drag the Customer ID field to the Drop Column Fields Here section, and drag the Sale field to the Drop Data Items Here section.
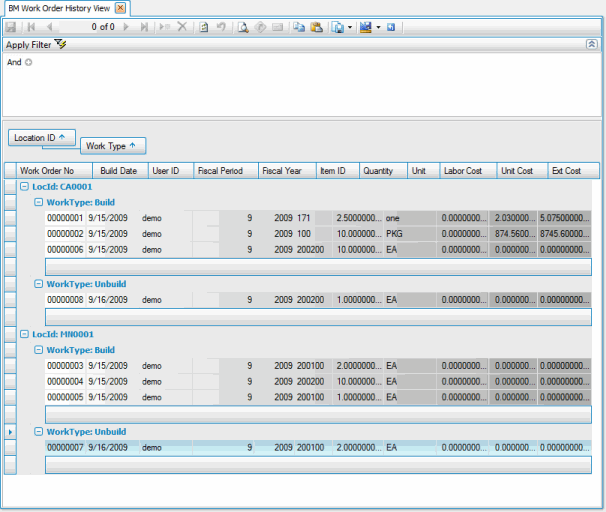
BM Work Order History View
You can group entries by identical column information to form expandable groups. To group by columns, click on the heading of the column to group and drag the heading to the Drag a column header here to group by that column section, above the other column headings. For instance, you could group the sort by two columns. Your primary group could be Location ID, and your secondary group Work Type. This would allow you to expand a location ID and view transactions grouped by work types of Build or Unbuild.
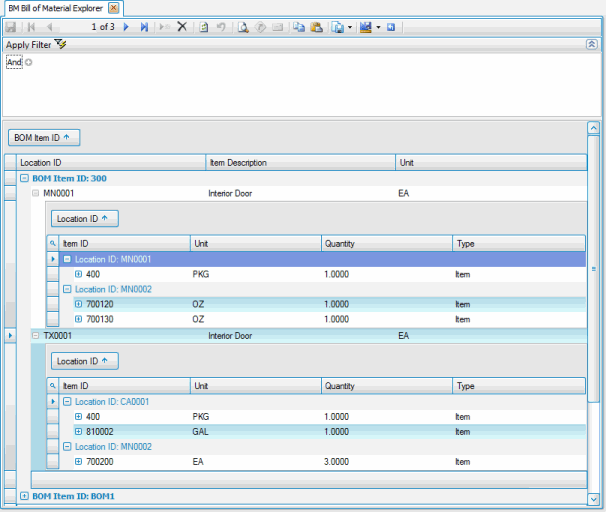
BM Bill of Material Explorer
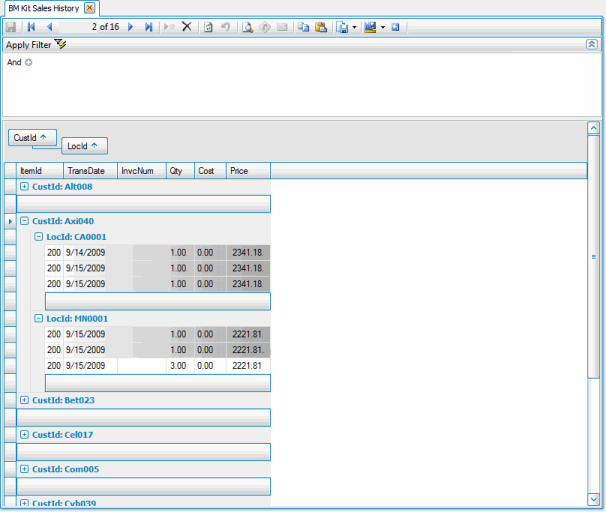
BM Kit Sales History View
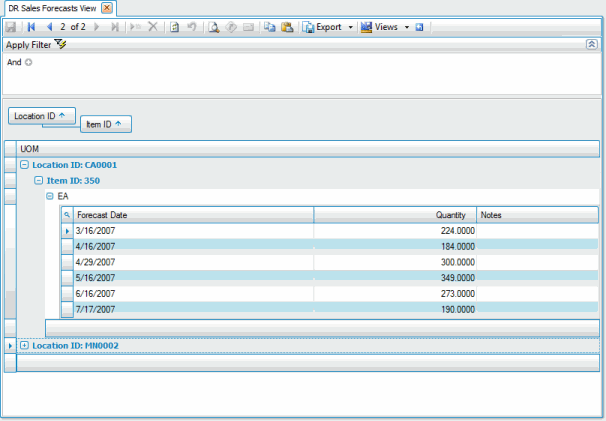
DR Sales Forecasts View
You can group entries by identical column information to form expandable groups. To group by columns, click on the heading of the column to group and drag the heading to the Drag a column header here to group by that column section, above the other column headings. For instance, you could group by two columns. Your primary group could be Location ID, and your secondary group Item ID. This would allow you to expand a Location ID group and view sales forecasts grouped by Item ID.
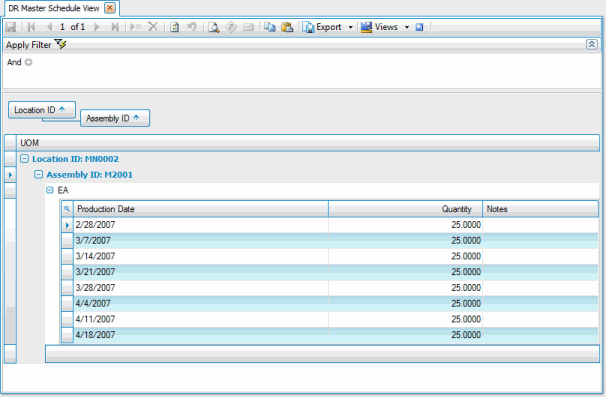
DR Master Schedule View
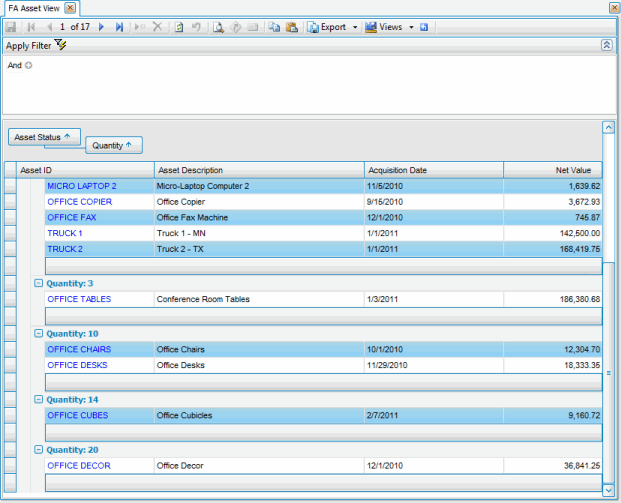
FA Asset View
You can group entries by identical column information to form expandable groups. To group by columns, click on the heading of the column to group and drag the heading to the Drag a column header here to group by that column section, above the other column headings. For instance, you could group by two columns. Your primary group could be Asset Status, and your secondary group Quantity. This would allow you to expand an Asset Status group and view assets grouped by quantity.
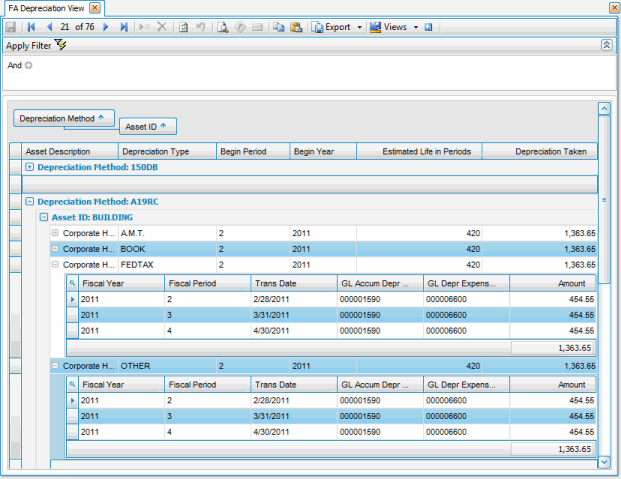
FA Depreciation View
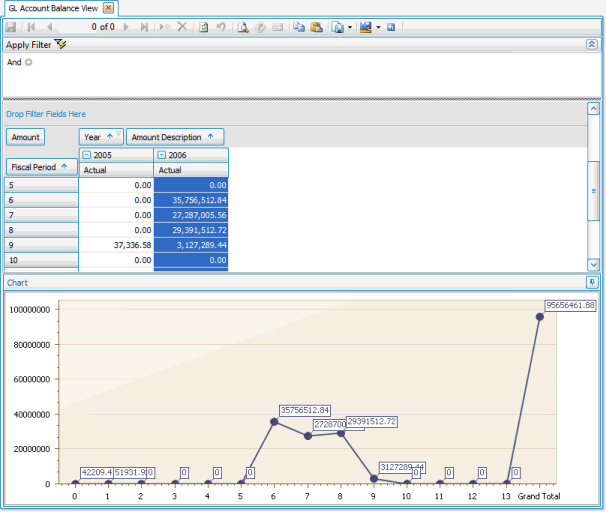
GL Account Balances View with Graphing Data
You can use the list of field headings to graph information. To graph information, simply click on the heading of the field and drag the heading to the Drop Data Items Here, Drop Row Fields Here, and/or Drop Column Fields Here sections. To not include a field as part of the graph, you can drag the heading to the Drop Filter Fields Here section, you can right-click on the heading and select Hide, or you can open the Field List editor and drag the heading into the list.
For instance, you could graph the actual balance for each fiscal period for a range of years. One way to do this would be to drag the Fiscal Period field to the Drop Row Fields Here section, drag the Year and Amount Description fields to the Drop Column Fields Here section, and drag the Amountfield to the Drop Data Items Here section.
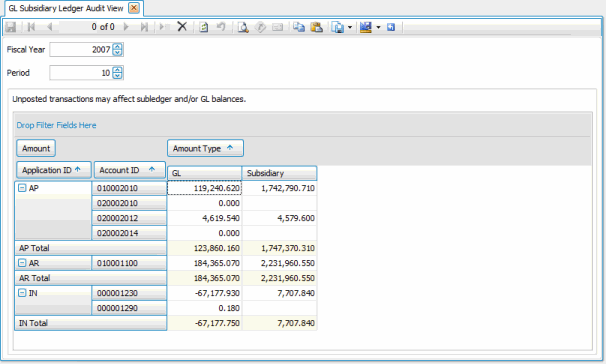
GL Subsidiary Ledger Audit View
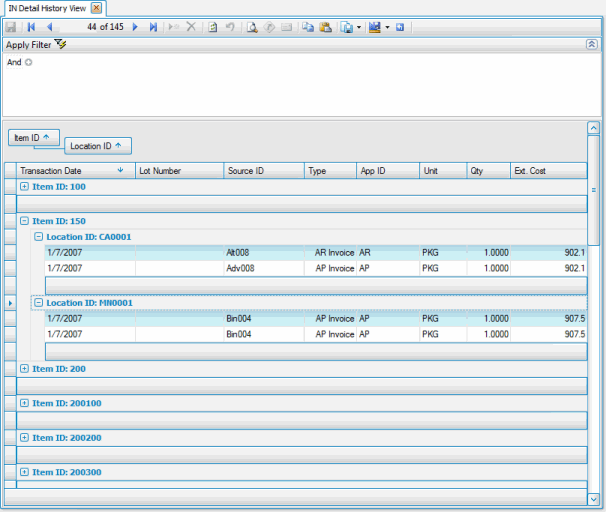
IN Detail History View
You can group entries by identical column information to form expandable groups. To group by columns, click on the heading of the column to group and drag the heading to the Drag a column header here to group by that column section, above the other column headings. For instance, you could group by two columns. Your primary group could be Item ID, and your secondary group Location ID. This would allow you to expand an Item ID group and view item information grouped by Location ID.
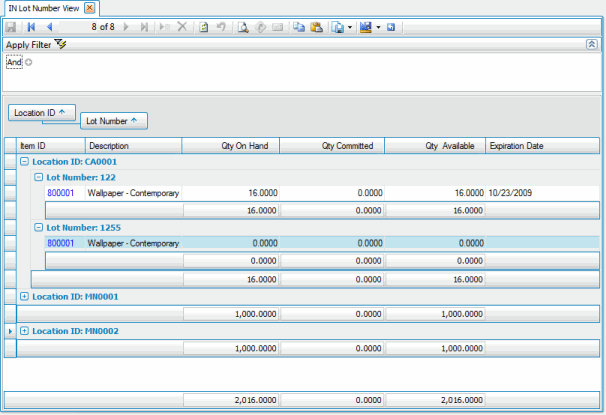
IN Lot Number View
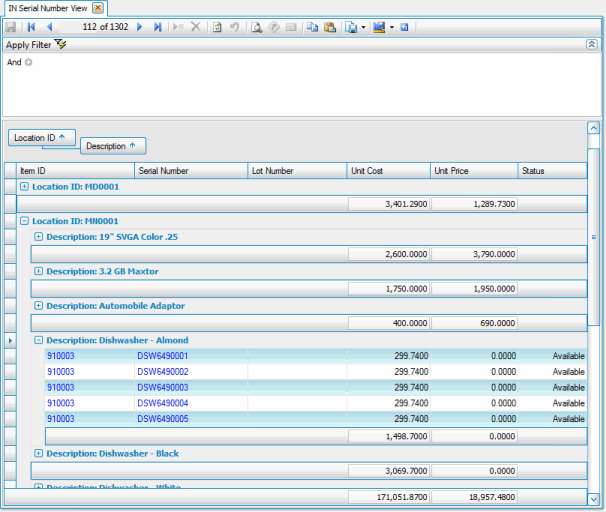
IN Serial Numbers View
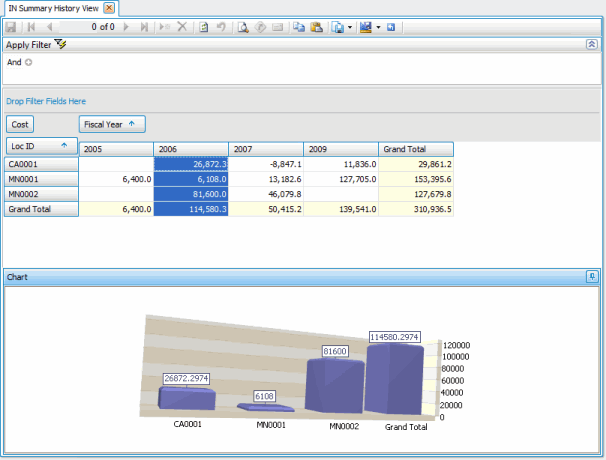
IN Summary History View with Graphing Data
You can use the list of field headings to graph information. To graph information, simply click on the heading of the field and drag the heading to the Drop Data Items Here, Drop Row Fields Here, and/or Drop Column Fields Here sections. To not include a field as part of the graph, you can drag the heading to the Drop Filter Fields Here section, you can right-click on the heading and select Hide, or you can open the Field List editor and drag the heading into the list.
For instance, you could graph the cost for each location in each fiscal year. One way to do this would be to drag the LocID field to the Drop Row Fields Here section, drag the Fiscal Year field to the Drop Column Fields Here section, and drag the Cost field to the Drop Data Items Here section.
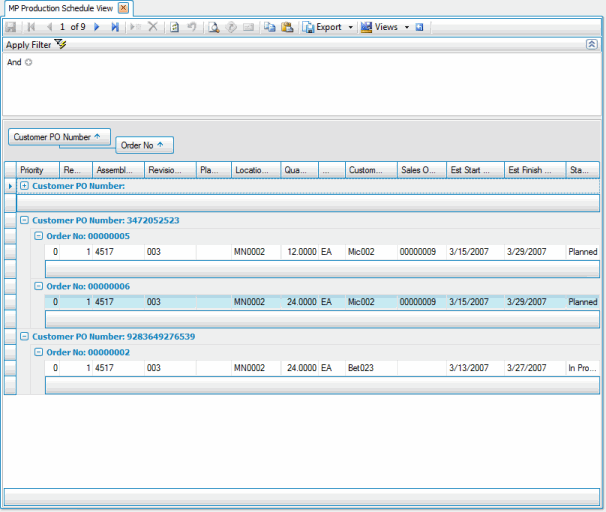
MFG-Production Schedule View
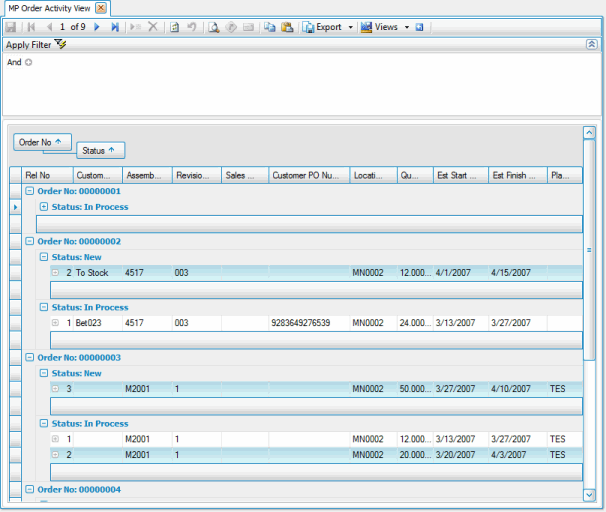
MFG-Production Order Activity View
MFG-Production GL WIP Transaction View
